
Core Web Vitals measure three things a shopper feels: how quickly the main content appears, how quickly the page responds to a tap, and whether the layout jumps around while loading. On Shopify stores, each metric tends to fail for a small number of recurring reasons, and those reasons differ by template.
This guide takes each metric in turn, explains what to look for on home, collection and product templates, and shows how to confirm a fix. If you have not yet confirmed that your store has a real speed problem, start with SERP Shout’s guide to finding the real Shopify speed bottlenecks.
The Three Metrics and Their Thresholds
Google’s web.dev guidance sets these “good” thresholds, measured at the 75th percentile of page loads and separately for mobile and desktop:
| Metric | What it measures | Good |
|---|---|---|
| Largest Contentful Paint (LCP) | When the largest visible element, often the main image or heading, finishes rendering | 2.5 seconds or less |
| Interaction to Next Paint (INP) | How quickly the page visibly responds after a tap, click or key press | 200 milliseconds or less |
| Cumulative Layout Shift (CLS) | How much visible content moves unexpectedly | 0.1 or less |
INP replaced First Input Delay as a Core Web Vital in 2024, so older advice about “FID” no longer applies.
The 75th percentile matters. A page passes only when at least three in four visits meet the threshold. A fast experience on your own phone does not mean the slowest quarter of your shoppers are having the same.
Read the Field Data First
Two sources give you real-user data on Shopify:
- Shopify’s web performance dashboard, based on real user data, with reports by page type, by URL and over time, including markers for app installs and theme updates.
- Search Console’s Core Web Vitals report, based on Chrome User Experience Report data, with similar URLs grouped together and mobile and desktop reported separately.
Note which metric fails on which template and device. Then move to lab tools, such as PageSpeed Insights or browser developer tools, to find the cause on a representative URL.
When you fix something, Search Console’s report lets you start a 28-day validation, which reflects how long it takes field data to catch up.
Diagnosing LCP
LCP is usually the main image on product pages, the hero banner or heading on the home page, and the first product images or banner on collection pages.
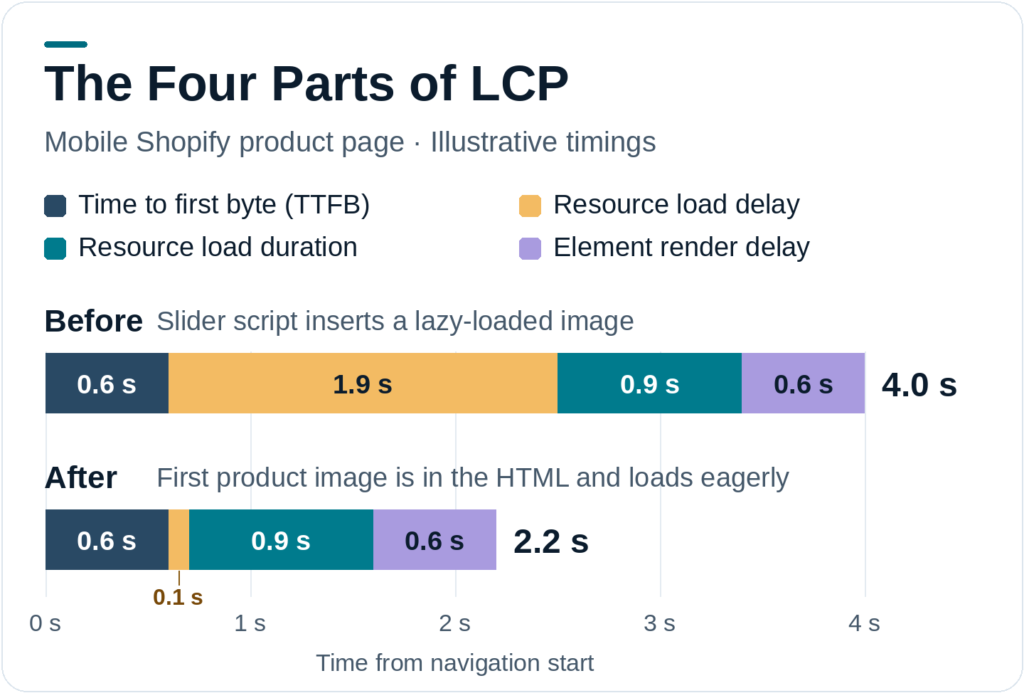
web.dev breaks LCP into four parts, which makes it much easier to see where time is going:
- Time to first byte: how long until the browser receives the start of the HTML.
- Resource load delay: the gap between that and when the browser starts loading the LCP image.
- Resource load duration: how long the image itself takes to download.
- Element render delay: the gap between the image arriving and it appearing on screen.
The guidance is that most of LCP should be spent on the first and third parts, with little time in the two delays. On Shopify stores, the delays are usually where the problem is.
Common Shopify causes of slow LCP
- The main image is lazy-loaded. web.dev is direct about this: never lazy-load the LCP image. Some custom sections and apps lazy-load every image, including the hero or main product photo. Shopify’s own
image_tagfilter lazy-loads images further down the page by default, so this usually comes from custom code. - The image is not in the initial HTML. Sliders and app-built galleries sometimes insert the main image with JavaScript after the page loads, which creates resource load delay and render delay.
- The image is too large for mobile. A 2,000-pixel banner served to a phone takes longer to download than it needs to.
- Render-blocking scripts and styles. Scripts in the page head can hold back rendering even after the image arrives.
- Slow first byte on specific templates. Heavy Liquid logic, such as complex collection filtering in theme code, can delay the HTML. Shopify’s Theme Inspector for Chrome helps profile this.
Template-specific checks
- Home page: if the hero is a slider, check whether the first slide is in the HTML and not lazy-loaded. Autoplay video heroes on mobile are a common cause of poor LCP.
- Collection page: check whether a large banner above the grid has become the LCP element. Sometimes removing or shrinking it is the simplest fix.
- Product page: check that the first gallery image is a real image element, loaded eagerly, at a sensible size.
Diagnosing INP
INP measures the delay between a shopper’s interaction and the next visible update. web.dev splits each interaction into three phases: input delay (waiting for the browser to start handling the tap), processing duration (running the code) and presentation delay (drawing the result).
On Shopify stores, slow INP usually comes from too much JavaScript running on the main thread, so the browser cannot respond promptly. web.dev identifies long tasks, heavy event handlers and large pages as typical causes.
Common Shopify causes of poor INP
- Variant pickers that run heavy scripts on every change, such as recalculating prices, swapping galleries and updating several app widgets at once.
- Add-to-cart buttons that trigger cart drawers, upsell pop-ups and tracking events all at the same moment.
- Filters on collection pages that re-render the whole grid with scripts on each tap.
- Menus and mega menus built with heavy scripts.
- Third-party widgets, such as reviews, chat, size recommendations, loyalty and personalisation, each adding script work.
How to find the culprit
Use your browser’s performance tools on a mobile-like setup and record yourself doing the slow interaction, for example choosing a size. Look for long tasks during the interaction and which scripts they come from. Then test on a duplicate theme by disabling the suspected app embed or script and repeating the interaction.
Fixes that usually help INP
- Load non-essential widgets only after the main content, or only when the shopper interacts with them.
- Ask app developers whether their script can be limited to the pages that need it.
- Reduce the work done on each variant change, for example by updating only what changed.
- web.dev recommends breaking long tasks up and yielding to the main thread, which is a developer-level change in theme or app code.
Diagnosing CLS
CLS measures unexpected movement of visible content. Shoppers notice it when they try to tap a button and it moves.
web.dev lists the main causes: images without set dimensions, ads and embeds without reserved space, content injected after load, web fonts that swap and change text size, and animations that move elements in layout-changing ways.
Common Shopify causes of poor CLS
- Announcement bars and banners that appear after the page has started rendering, pushing everything down.
- Review stars and badges injected under product titles by apps after load.
- Images without width and height, in custom sections or apps. Shopify’s
image_tagadds width and height by default, so the issue usually comes from custom code. - Cookie and consent banners that push content instead of overlaying it.
- Web fonts that load late and change the size of headings.
Fixes that usually help CLS
- Reserve space for elements that load later, using a minimum height.
- Render announcement bars in the initial HTML rather than injecting them.
- Make sure every image has width and height or an aspect ratio set.
- Place late-loading widgets lower on the page, below content shoppers are reading.
- Use font loading settings that reduce visible swaps.
A Template-by-Template Summary
| Template | Usual LCP element | Common INP issue | Common CLS issue |
|---|---|---|---|
| Home | Hero image, slider or video | Menus, pop-ups | Announcement bar, injected banners |
| Collection | Banner or first product images | Filters, quick view | Late-loading badges on product cards |
| Product | First gallery image | Variant picker, add to cart | Review stars, app widgets near the title |
When Only Some Pages Fail
Search Console groups URLs with similar experiences, and Shopify’s dashboard can show individual URLs. Sometimes one group of product pages fails while the rest pass. Before changing the template, look for what those pages have in common:
- A different product template, for example one built for bundles or made-to-order items
- Much larger galleries, videos or 3D models
- An app block added only to some products, such as a size chart, customiser or subscription widget
- Very long descriptions with embedded images or tables that load slowly
- Traffic mainly from a region or device type with slower connections
Fixing the specific difference is often faster and safer than reworking the whole product template.
Confirming a Fix
Lab tests are useful for checking that a change helped, but they do not change your field data. After publishing a fix:
- Re-run lab tests on the affected template several times to confirm a consistent improvement.
- Watch Shopify’s dashboard over the following days and weeks for the metric to move.
- In Search Console, start validation for the issue and wait for the 28-day tracking to finish.
Keep notes of each change and its date, so you can link improvements, or regressions, to specific work.
What Not to Chase
- A perfect lab score. Field data is what reflects shoppers.
- Desktop scores when mobile is where shoppers struggle.
- Every warning in a lab report. Focus on what affects the failing metric on the failing template.
Google’s page experience guidance is clear that good Core Web Vitals help but do not guarantee rankings, and that relevance comes first. Fix what makes the store feel slow to shoppers, and treat any search benefit as a bonus.
If your store fails Core Web Vitals across several templates, the work usually needs a developer. Our technical SEO work for ecommerce stores includes performance diagnosis on Shopify themes.